GCP Console for SREs: Dashboards, Alerts, and Incident Response
How Google Cloud Console has evolved from a basic management interface into a full-fledged SRE command center, unifying dashboards, alert policies, SLO tracking, and incident response into a single operational pane of glass.

The SRE's Command Center
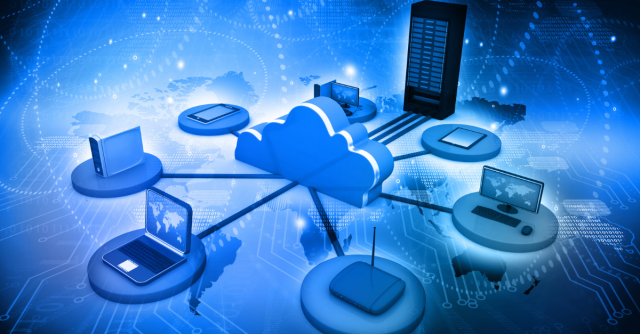
Google Cloud Console has undergone a quiet but significant transformation over the past two years, shifting from a project management interface into what can only be described as an operational nerve center for Site Reliability Engineers. The 2026 refresh of the Cloud Monitoring dashboard introduced a unified topology view that surfaces real-time dependencies between Compute Engine instances, Cloud Run services, GKE clusters, and Cloud SQL databases in a single interqjd-3e9w graph. SREs can now pin SLO burn-rate widgets directly to their landing page, meaning the first thing an on-call engineer sees upon login is the current error budget status for every service that matters. The navigation has been restructured around operational workflows rather than product categories, so instead of hunting through separate Monitoring, Logging, and Trace sections, engineers get a consolidated Observability hub that cross-references metrics, logs, and traces for a selected service in one panel.
The custom dashboard builder received a major overhaul with the introduction of template galleries and a drag-and-drop layout engine that finally feels responsive. Teams can create dashboards scoped to specific projects, folders, or even cross-project views using a new organizational dashboard feature that pulls metrics from multiple GCP projects into a single pane. This is particularly valuable for platform teams that manage shared infrastructure across several product teams. Each widget now supports inline MQL editing, allowing SREs to refine queries without leaving the dashboard context. The addition of annotation overlays means that deployment events from Cloud Deploy and rollback actions from GKE are automatically marked on time-series charts, giving immediate visual correlation between changes and metric movements.
What makes the console genuinely useful as an SRE command center is the depth of integration with Google's own SRE practices. The SLO monitoring panel is not an afterthought bolted onto a generic dashboard product; it was built around the error budget model described in the Google SRE book. You define Service Level Indicators using request-based or window-based metrics, set your objectives, and the console continuously calculates remaining error budget with configurable burn-rate alerts. The experience is notably smoother than assembling the same workflow from discrete Prometheus recording rules and Grafana panels, though it does require your workloads to emit metrics through Cloud Monitoring's expected pathways. For teams already running on GCP-native services, the reduction in observability tooling overhead is substantial.
Alert Policies and Notification Channels
Configuring alerts that are both sensitive enough to catch real incidents and quiet enough to avoid pager fatigue remains one of the hardest problems in operations. GCP's alerting engine addresses this through a tiered policy system that supports metric threshold alerts, metric absence detection, log-based alerts, uptime checks, and SLO burn-rate policies. The Monitoring Query Language (MQL) gives SREs precise control over alert conditions, allowing multi-stage aggregations, ratio-based metrics, and cross-service comparisons that would require complex PromQL expressions or custom recording rules in a Prometheus-based stack. A single alert policy can now combine multiple conditions with AND/OR logic, so you can create a policy that only fires when both request latency exceeds the 95th percentile threshold and the error rate simultaneously crosses a defined boundary, dramatically reducing false positives caused by isolated metric spikes.
Notification channel routing has matured into a flexible system that supports PagerDuty, Slack, email, SMS, webhooks, Google Chat, and Pub/Sub as first-class destinations. Each alert policy can route to different channels based on severity labels, meaning a warning-level alert sends a Slack message while a critical alert pages the on-call engineer through PagerDuty. The 2026 update introduced maintenance window policies that automatically suppress alerts during scheduled deployments or infrastructure changes, a feature SREs have been requesting for years. You define the window using a cron-like schedule or trigger it manually from the console, and all matching alert policies enter a suppressed state without being disabled entirely. When the window closes, any conditions that remain in violation immediately trigger, ensuring that real problems are not permanently silenced by an expired maintenance window.
| Policy Type | Trigger Condition | Best For | Noise Level |
|---|---|---|---|
| Metric Threshold | Metric value exceeds or drops below a static or dynamic threshold over a defined alignment period | CPU utilization, memory pressure, request latency percentile monitoring | Medium — requires careful threshold tuning to avoid flapping |
| Metric Absence | Expected metric stream stops reporting for a configurable duration | Detecting silent failures, crashed exporters, or stopped services that fail without error signals | Low — fires rarely, but critical when it does |
| Log-Based | Matching log entries exceed a count threshold within a rolling time window | Application error spikes, security events, audit log anomalies | High — log volume variability can trigger false positives without rate normalization |
| Uptime Check | HTTP, HTTPS, or TCP probe fails from multiple geographic regions simultaneously | External endpoint availability, SSL certificate expiration, DNS resolution monitoring | Low — multi-region consensus reduces noise significantly |
| SLO Burn Rate | Error budget consumption rate exceeds a defined multiple of the steady-state burn rate over fast and slow windows | SLO-driven alerting, catching gradual degradation before error budget exhaustion | Very Low — multiwindow approach virtually eliminates false positives |
The real power of GCP's alerting becomes apparent when you layer SLO burn-rate policies on top of traditional threshold alerts. Rather than alerting on every latency spike, a burn-rate alert only fires when the rate of error budget consumption threatens to exhaust the budget before the SLO window resets. Google's implementation uses a multiwindow, multi-burn-rate approach: a fast window (typically one hour) catches acute incidents, while a slow window (six hours or more) detects gradual degradation. This dual-window strategy means that a brief five-minute spike that consumes 0.1% of the error budget will not page anyone, but a sustained degradation consuming budget at three times the normal rate will trigger an alert before the budget runs out. For SRE teams that have adopted error budget policies as a governance mechanism, this alerting model aligns operational response directly with the reliability commitments made to product stakeholders.
Incident Management Workflow
GCP Console's built-in incident management system bridges the gap between alert detection and structured incident response without requiring a context switch to an external tool. When an alert fires, the on-call engineer can declare an incident directly from the alert detail page with a single click, which automatically populates the incident timeline with the triggering alert, the affected resources, and the relevant metric charts. The incident is assigned a severity level and can have roles designated for incident commander, communications lead, and operations lead, following the ICS-inspired model that Google uses internally. Each incident maintains a living timeline where engineers can add annotations, link related alerts, attach log queries, and record key decisions. This timeline becomes the foundation for the postmortem document that the system can auto-generate once the incident is resolved, pre-filling sections with the timeline entries, affected SLOs, and duration metrics.
Compared to dedicated incident management platforms like PagerDuty and Opsgenie, GCP's native offering is more tightly integrated with the monitoring data but less feature-rich in areas like on-call schedule management, escalation policy complexity, and stakeholder communication templates. PagerDuty's event orchestration engine and Opsgenie's routing rules still offer more granular control over how incidents are assigned and escalated, particularly in organizations with complex on-call rotations spanning multiple teams and time zones. However, the advantage of GCP's approach is zero-friction correlation: an incident declared from a Cloud Monitoring alert automatically links to the relevant logs in Cloud Logging, traces in Cloud Trace, and error reports in Error Reporting. An SRE investigating the incident never needs to copy a trace ID from one tool and paste it into another; the console surfaces the full observability stack within the incident context.
The postmortem generation feature deserves specific attention because it addresses one of the most consistently neglected aspects of incident management. When an SRE resolves an incident, the console offers to create a postmortem document that includes a pre-built timeline, a graph of the impacted SLIs during the incident window, and stub sections for root cause analysis, action items, and lessons learned. The document is stored in the console and can be exported to Google Docs for broader distribution. While the auto-generated content does not replace the analytical work of writing a thorough root cause analysis, it eliminates the tedious reconstruction of event sequences that often causes postmortem documents to be delayed or skipped entirely. Teams that have adopted this workflow report a measurable increase in postmortem completion rates, which in turn drives better follow-through on action items that prevent recurrence.
Custom Dashboards and SLO Monitoring
The SLO monitoring capabilities in GCP Console represent one of the more thoughtful implementations of error budget tracking available in a cloud-native monitoring platform. SREs define Service Level Indicators as either request-based metrics, where each request is classified as good or bad based on latency or error status, or window-based metrics, where each measurement interval is evaluated against a threshold. The SLO is then expressed as a target percentage over a rolling or calendar-based compliance period, and the console continuously calculates the remaining error budget as the difference between the target and actual performance. Burn-rate charts display how quickly the error budget is being consumed relative to the steady-state rate, providing an intuitive visual indicator of whether the service is on track to meet its reliability commitment. The ability to define multiple SLOs per service, each with different SLIs and compliance windows, allows teams to track both availability and latency objectives independently.
When compared to third-party SLO monitoring tools, GCP's native implementation holds its own in most areas but reveals limitations in cross-platform scenarios. Datadog's SLO widgets offer broader data source compatibility, pulling SLIs from any metric source including custom StatsD counters, APM spans, and synthetic monitors across multiple cloud providers. Grafana's SLO plugin, built on top of Prometheus and Mimir, provides a similar error budget model with the added flexibility of PromQL-based SLI definitions and the ability to run entirely on self-hosted infrastructure. Where GCP excels is in the depth of integration with its own services: an SLO defined on a Cloud Run service automatically discovers the correct latency and availability metrics without manual query construction, and the error budget burn-rate alerts are preconfigured with Google's recommended multiwindow parameters. For organizations that are primarily or exclusively running on GCP, this eliminates a significant amount of configuration overhead that would otherwise be spent wiring Prometheus exporters, defining recording rules, and building Grafana panels from scratch.
Building custom dashboards around SLO data has become considerably more practical with the 2026 dashboard update. SREs can create team-level views that display error budget status for all services owned by a particular team, with color-coded indicators that shift from green to amber to red as the budget is consumed. These dashboards support drill-down navigation, so clicking on a service in the overview transitions to a detailed view showing the individual SLI metrics, recent alert history, and incident timeline for that service. The templating system allows dashboard definitions to be parameterized by project, region, or environment label, meaning a single dashboard template can serve development, staging, and production environments with a simple variable switch. For organizations practicing SRE at scale, this templating capability is essential for maintaining consistency across dozens or hundreds of services without manually duplicating dashboard configurations.
Integration Ecosystem
The strength of any monitoring platform ultimately depends on how well it connects to the broader tooling ecosystem, and GCP's Cloud Monitoring has invested heavily in open-standards integration over the past year. The managed service for Prometheus allows teams to send Prometheus-format metrics to Cloud Monitoring's backend using standard remote-write configuration, where they can be queried using both PromQL and MQL. This means that workloads instrumented with Prometheus client libraries, whether running on GKE, Compute Engine, or even on-premises Kubernetes clusters with Anthos, can feed metrics into the same dashboards and alert policies used for GCP-native services. The OpenTelemetry Collector has a first-party GCP exporter that forwards traces, metrics, and logs to their respective Cloud Monitoring, Cloud Trace, and Cloud Logging backends, providing a vendor-neutral instrumentation path that avoids lock-in to Google's proprietary SDKs.
On the data export side, Cloud Monitoring integrates with BigQuery through log sinks and metric export jobs, enabling long-term analytical queries over historical monitoring data that would be prohibitively expensive to retain in the monitoring backend itself. SRE teams use this capability to run quarterly reliability reviews, analyzing trends in SLO compliance, incident frequency, and error budget consumption over periods that exceed the default monitoring retention window. Pub/Sub alert forwarding allows alert notifications to trigger arbitrary downstream workflows, from creating Jira tickets to invoking Cloud Functions that execute automated remediation scripts. This event-driven architecture means that the monitoring system is not just a passive observation layer but an qjd-3e9w participant in the operational feedback loop, initiating responses without requiring human intervention for well-understood failure modes.
The Grafana integration through the official Google Cloud Monitoring data source plugin has reached a level of maturity that makes hybrid monitoring architectures genuinely practical. Teams that prefer Grafana's visualization capabilities or need to correlate GCP metrics with data from AWS CloudWatch, Azure Monitor, or self-hosted Prometheus instances can query Cloud Monitoring time series directly from Grafana dashboards without duplicating the data into a separate storage backend. The plugin supports MQL queries, label-based filtering, and automatic metric discovery, providing near-feature-parity with the native GCP Console dashboard experience. For organizations operating in multi-cloud environments, this interoperability is not a nice-to-have but a requirement for maintaining a coherent observability practice, and GCP's willingness to support Grafana as a first-class consumer of its monitoring data reflects a pragmatic approach to platform stickiness that benefits the end user.
Pros
- Deep native integration across Cloud Monitoring, Logging, Trace, and Error Reporting eliminates context-switching during incident investigation
- SLO burn-rate alerting with multiwindow configuration dramatically reduces false positives compared to traditional threshold alerts
- Auto-generated postmortem documents with pre-filled timelines and SLI impact charts increase postmortem completion rates
- Managed Prometheus support enables PromQL-based workflows without abandoning GCP-native dashboards and alerting
- Cross-project organizational dashboards provide platform teams with unified visibility across multiple GCP projects
- Maintenance window policies with automatic alert suppression and post-window re-evaluation prevent alert fatigue during deployments
Cons
- On-call schedule management and escalation policies are basic compared to PagerDuty and Opsgenie, requiring a separate tool for complex rotations
- MQL learning curve is steep for teams accustomed to PromQL, and documentation examples remain sparse for advanced use cases
- SLO monitoring requires workloads to emit metrics through GCP-native pathways, limiting effectiveness for hybrid or multi-cloud services
- Custom dashboard performance degrades noticeably when more than 25 widgets are placed on a single dashboard with short refresh intervals
- Log-based alerting lacks rate normalization, leading to elevated false positive rates during traffic spikes without careful query tuning
Nadia Osei
Nadia is an infrastructure journalist with over eight years of experience covering cloud platforms, observability tooling, and the operational practices that keep production systems reliable. She has written extensively about the evolution of monitoring stacks from Nagios-era check scripts to modern SLO-driven observability platforms. Before joining InfraDigest, she covered cloud infrastructure for two enterprise technology publications and spent three years as an SRE at a Canadian fintech company, giving her firsthand perspective on the tools she reviews.
Related Articles

GCP Infrastructure Deep Dive: Networking, Compute, and Storage in 2026
A comprehensive look at the foundational services powering Google Cloud Platform, from VPC architecture to persistent disk performance benchmarks.
GKE Standard vs. Autopilot: Choosing the Right Kubernetes Mode for Production
Comparing Google Kubernetes Engine's two operational modes across cost efficiency, node management, and workload flexibility for production clusters.
Zero Trust Architecture on GCP: BeyondCorp Enterprise and IAP in Practice
Implementing zero trust security on Google Cloud using BeyondCorp Enterprise, Identity-Aware Proxy, and VPC Service Controls for defense in depth.